程序员利用 OpenClaw 构建量化模型分析标普 500 波动率结构以预测市场不稳定。
投研分析📅 2026/03/15

#API#Crypto#手动触发#中风险#可复用#半自动#交易员#报告#美股#行情数据
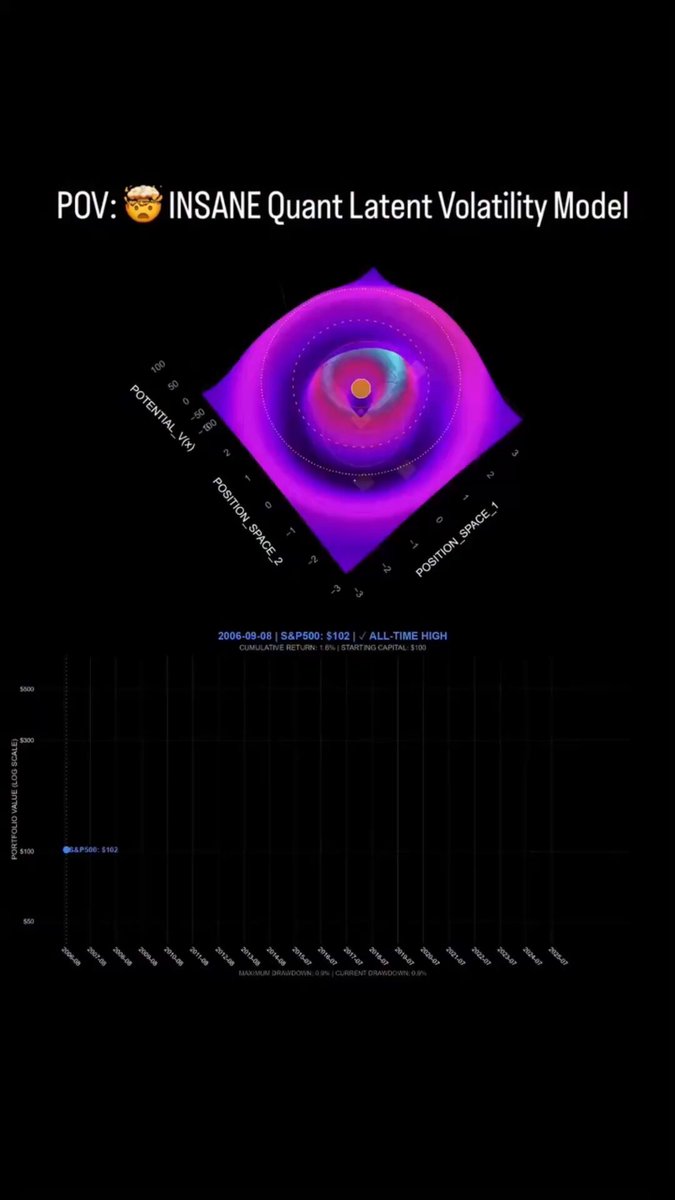
A Programmer Built a Quant Model with OpenClaw that Analyzes the S&P 500.

Not the price.

The volatility structure behind it.

The model maps a 3D "risk surface" of the market.

When the peak shifts away from equilibrium…

Large market moves often follow.

So I asked OpenClaw what was actually happening in this video.

It explained the structure behind the model.

A trader on Polymarket appears to be using something similar.

Look at the account above.

$75K profit and 107 predictions.

Mostly S&P 500 markets.

But the system isn’t predicting direction.

It’s detecting when the market becomes unstable.

The structure Claude described looks like this:
> map the latent volatility surface of the market
> detect shifts away from equilibrium
> reduce exposure before volatility shocks
> re-enter once the system stabilizes

Just volatility structure.

Sometimes the real edge in markets…

is seeing instability before it shows up on the chart.